Job Transcribe
2023 public experiment revisit

Revisiting Korean STT with 3,922 utterances and 3 call-center scenarios

In 2023, I designed and ran a Korean ASR/STT experiment using publicly available products and open models. This page revisits the real repository data through distributions, thresholds, paired comparisons, worst cases, and numeric-format sensitivity instead of reducing the work to a single average CER.

This is a retrospective analysis of a personal 2023 experiment using publicly accessible products and open-source models. It does not represent current Microsoft/Azure, AWS, Clova, GCP, or OpenAI/Whisper performance, and it is not an official benchmark or internal performance dataset from any company.
3,922 single-speaker utterances
2.22% Whisper large mean CER
83.20% Whisper large CER <= 5%
Essay

The work behind the published article

This is not a leaderboard. It is a record of the questions I had to answer while testing Korean speech recognition: what counts as correct, which metric should be trusted, and how much error can a workflow tolerate?

The original question sounded simple: if Korean speech-to-text were attached to a real work process, which model would transcribe it well enough? The more important question appeared only after the testing started: what does "well enough" mean, and under which reference text policy should it be measured?

Original Korean columns: ITDaily ComputerWorld

Context: the metric had to come before the model comparison

Cloud STT products and Whisper models all return transcripts, but they do not fail in the same way. Some outputs only changed spacing. Some wrote spoken numbers as digits. Some broke on proper nouns, loanwords, or domain-specific expressions. Reading the transcripts by eye was not enough. I needed the same audio, the same reference text, and the same error formula across every result.

That is why I built Compute STT Error Rate, the Nlptutti package. The public repository is computing-Korean-STT-error-rates, and the benchmark scripts import it as nlptutti. Nlptutti provides get_cer, get_wer, get_crr, and Korean keyword-pattern utilities. Internally, it uses Levenshtein edit distance to count substitutions, deletions, and insertions, while fixing whitespace and punctuation handling in code.

I built it because the denominator mattered. If CER is computed only against the reference length, transcripts with many insertions can exceed 1 or move outside the range I wanted for repeated comparison. Nlptutti keeps S+D+I as the error numerator, but uses S+D+I+C as the denominator, including insertions in the normalized error rate. That small choice made the results easier to compare across thousands of Korean transcripts.

Process: two test surfaces, not one

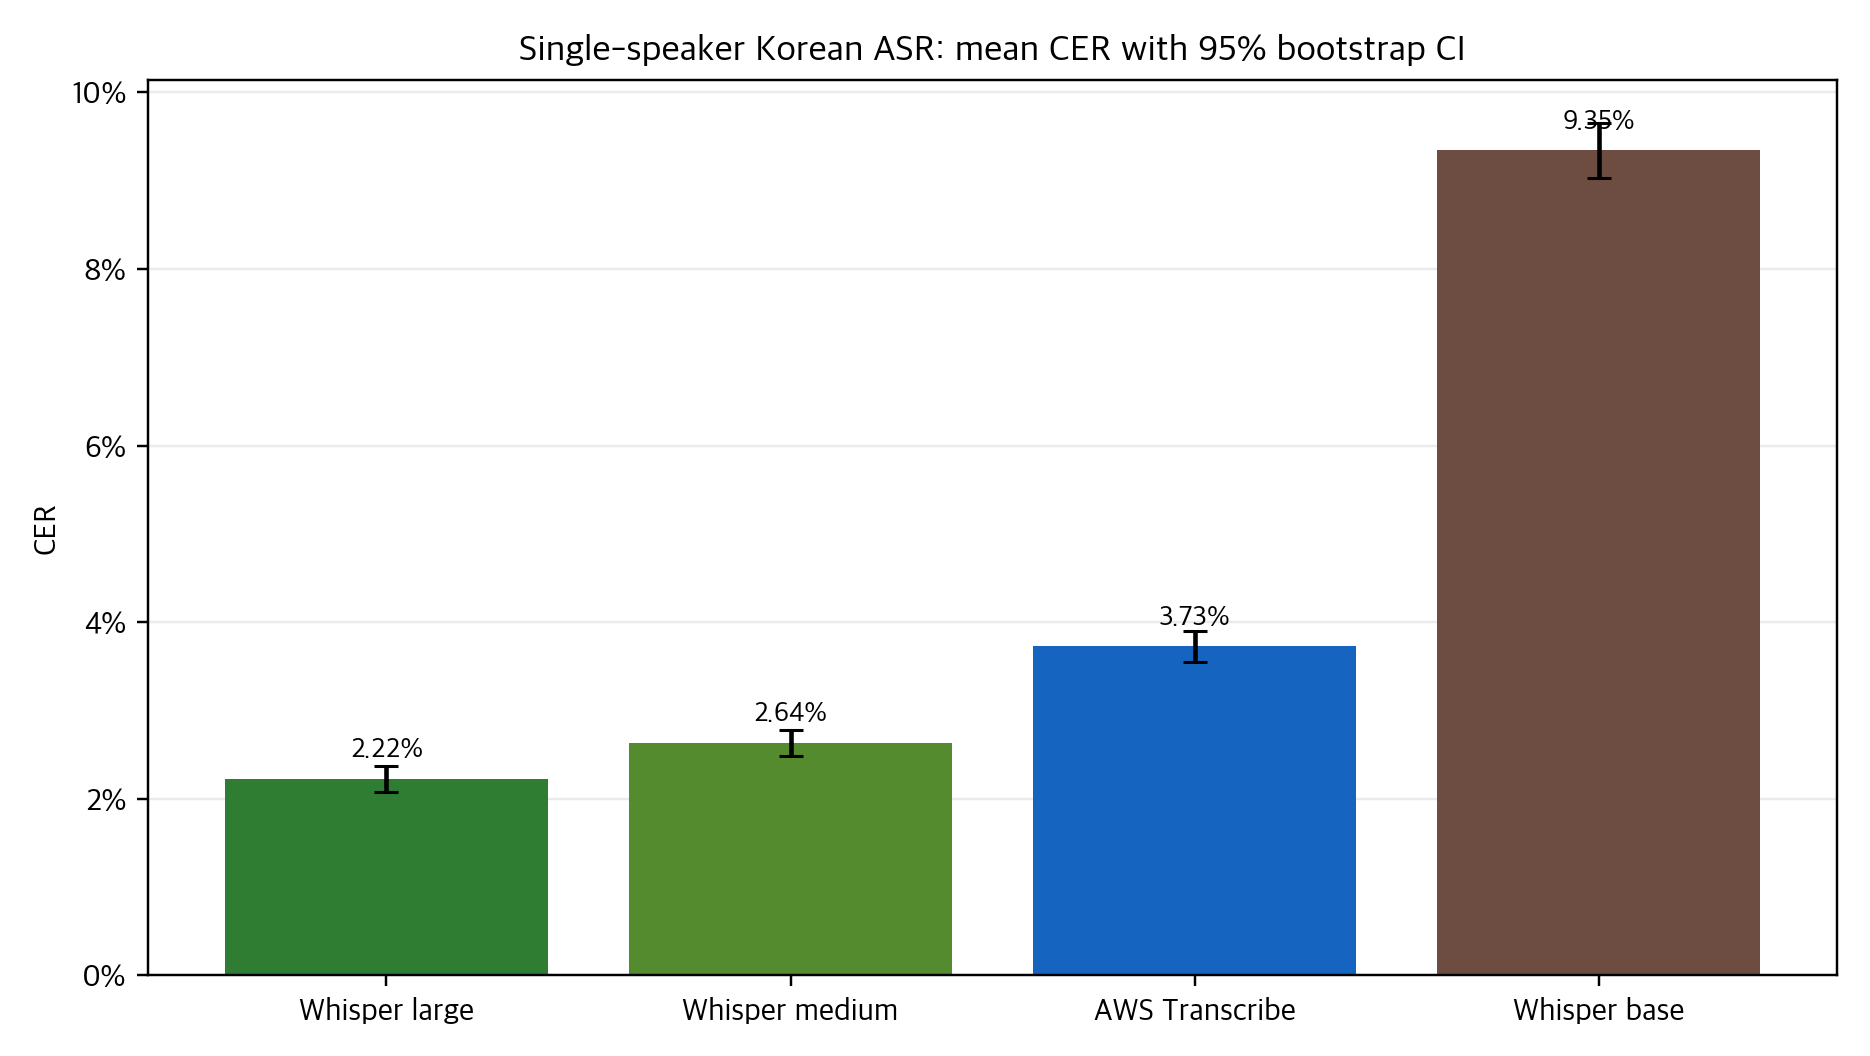
The primary benchmark used 3,922 single-speaker utterances. For each shared file_name and ground_truth, I collected transcripts from AWS Transcribe and Whisper base, medium, and large. Each row kept the reference sentence, model output, and CER, so the data could be analyzed by mean error, threshold pass rate, paired delta, and worst-case examples.

The core 3,922 utterances were my own voice data. I recorded them in my home study, the quietest space I had, with a daily target of about 50 sentences. Each sentence was saved as a WAV file through a multi-pattern USB condenser microphone in cardioid pickup mode. The accumulated reading and recording time was close to eight hours. Across roughly three months, I led the experiment design, recording, STT runs, result collection, and metric stabilization.

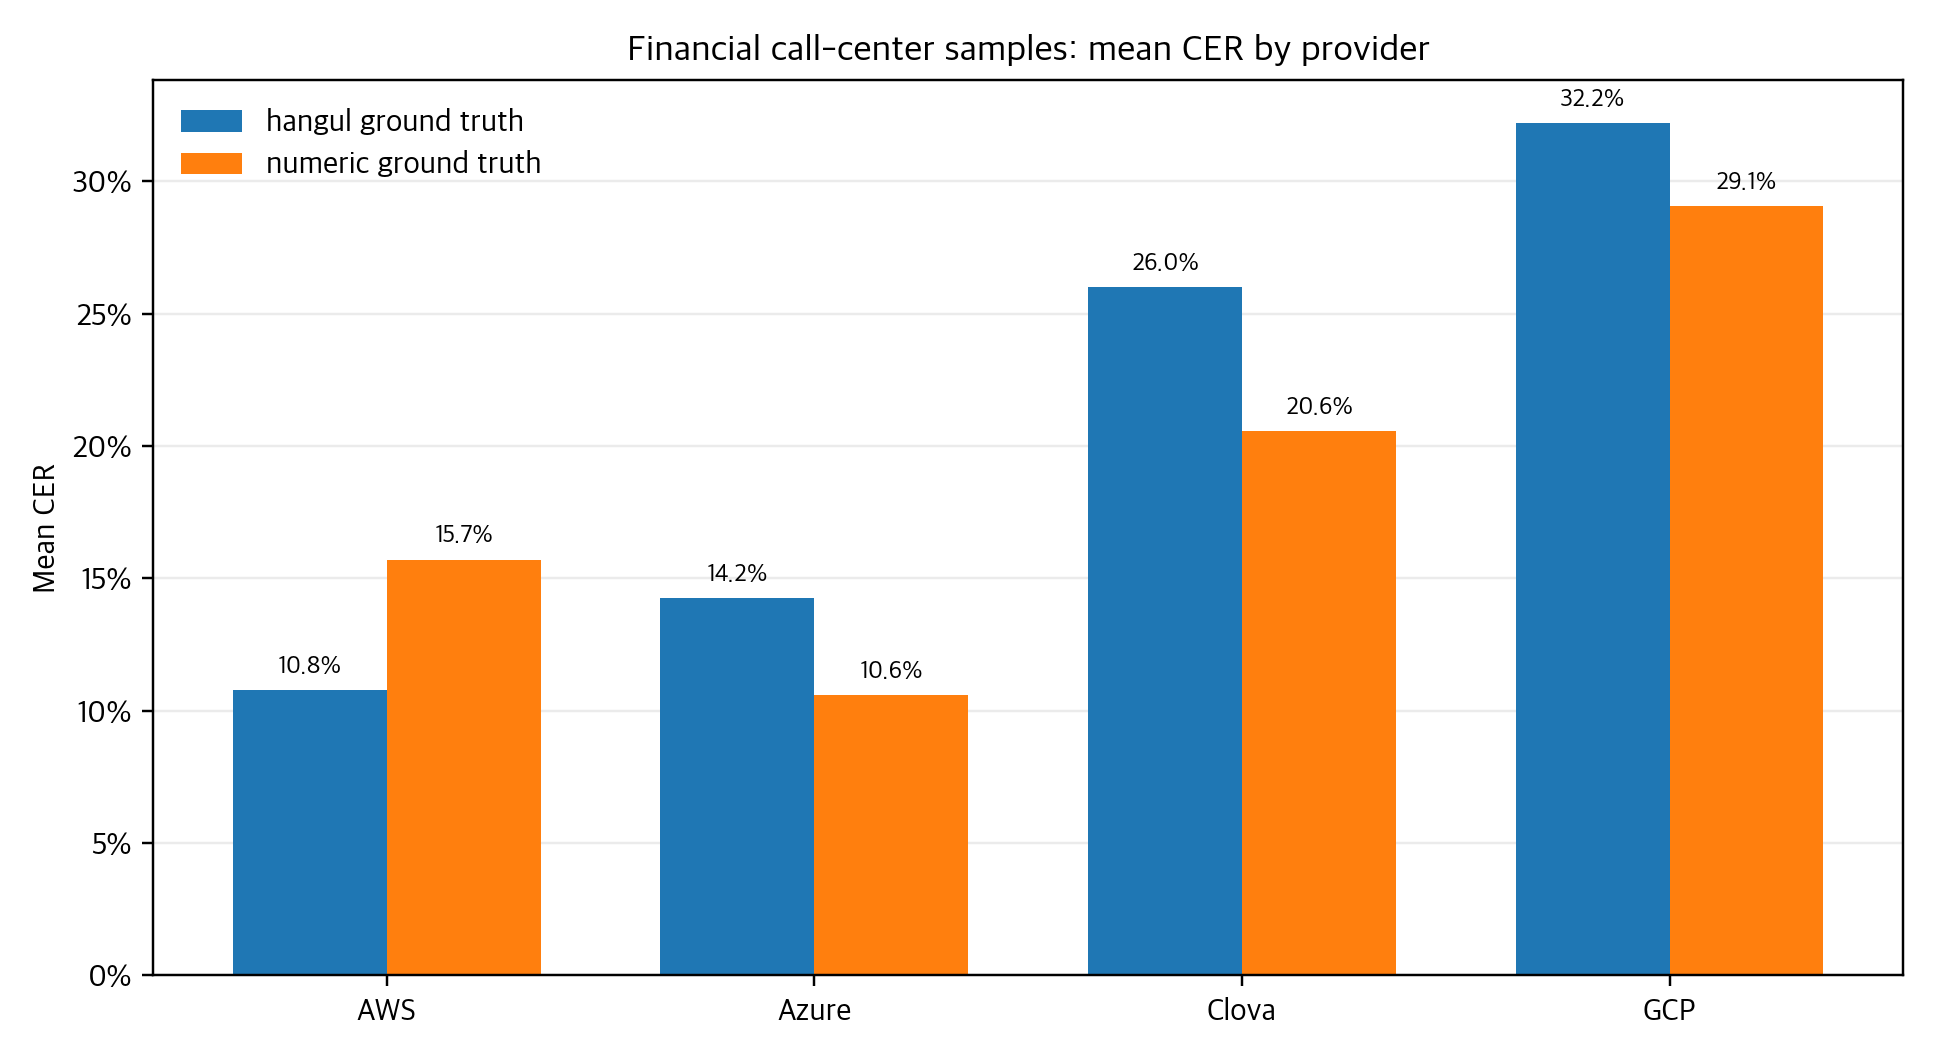
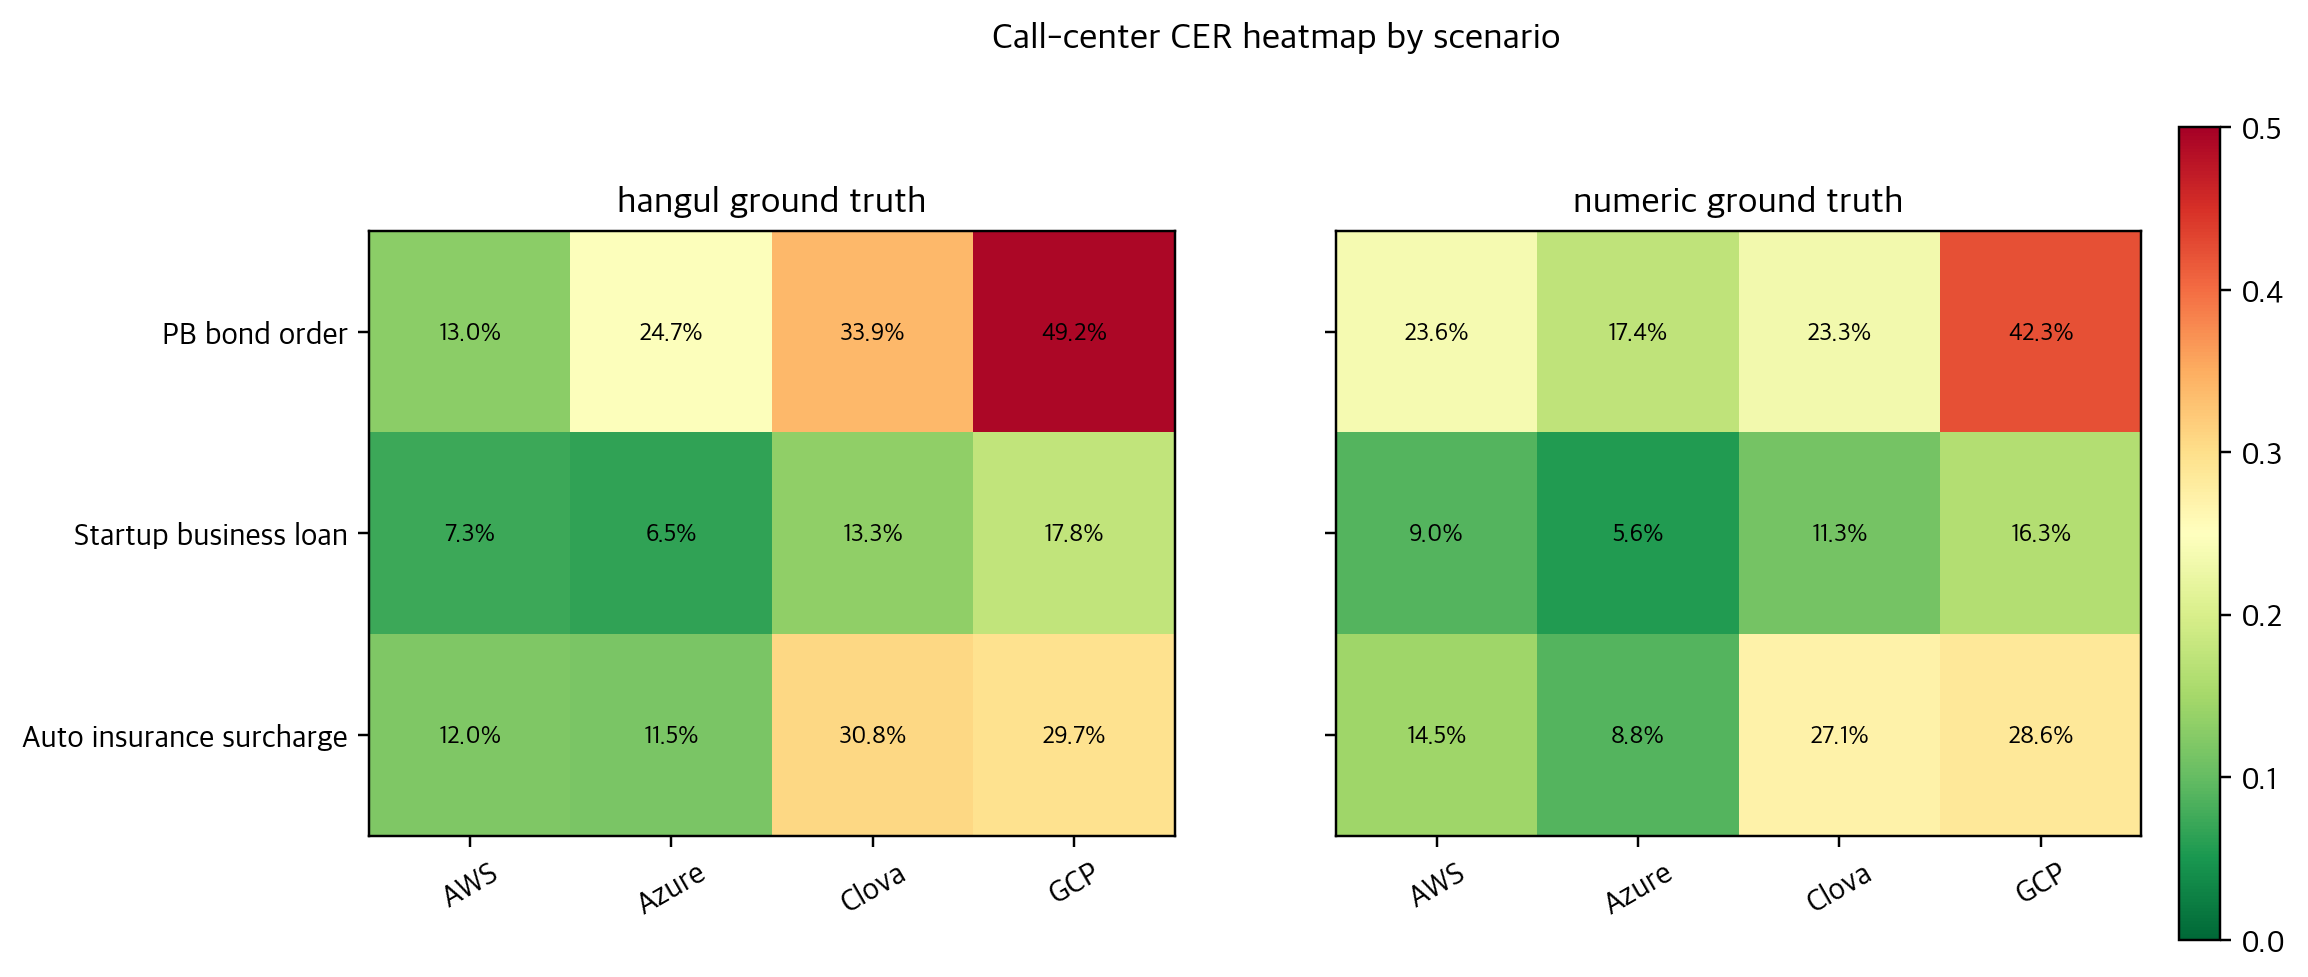
The second surface was a smaller set of three financial call-center personas: PB bond ordering, startup loan guidance, and an auto-insurance premium inquiry. The point was to run a quick practical check on conversations where phone numbers, account numbers, amounts, and dates matter. A few teammates joined a roughly 30-minute meeting and recording session. Because it happened in a meeting room, I used a personally purchased multi-pattern USB condenser microphone in bidirectional pickup mode, trying to capture both sides of a one-to-one conversation evenly. This was not meant to rank providers. It was meant to show how numbers, domain vocabulary, and reference-text policy can move CER in different directions.

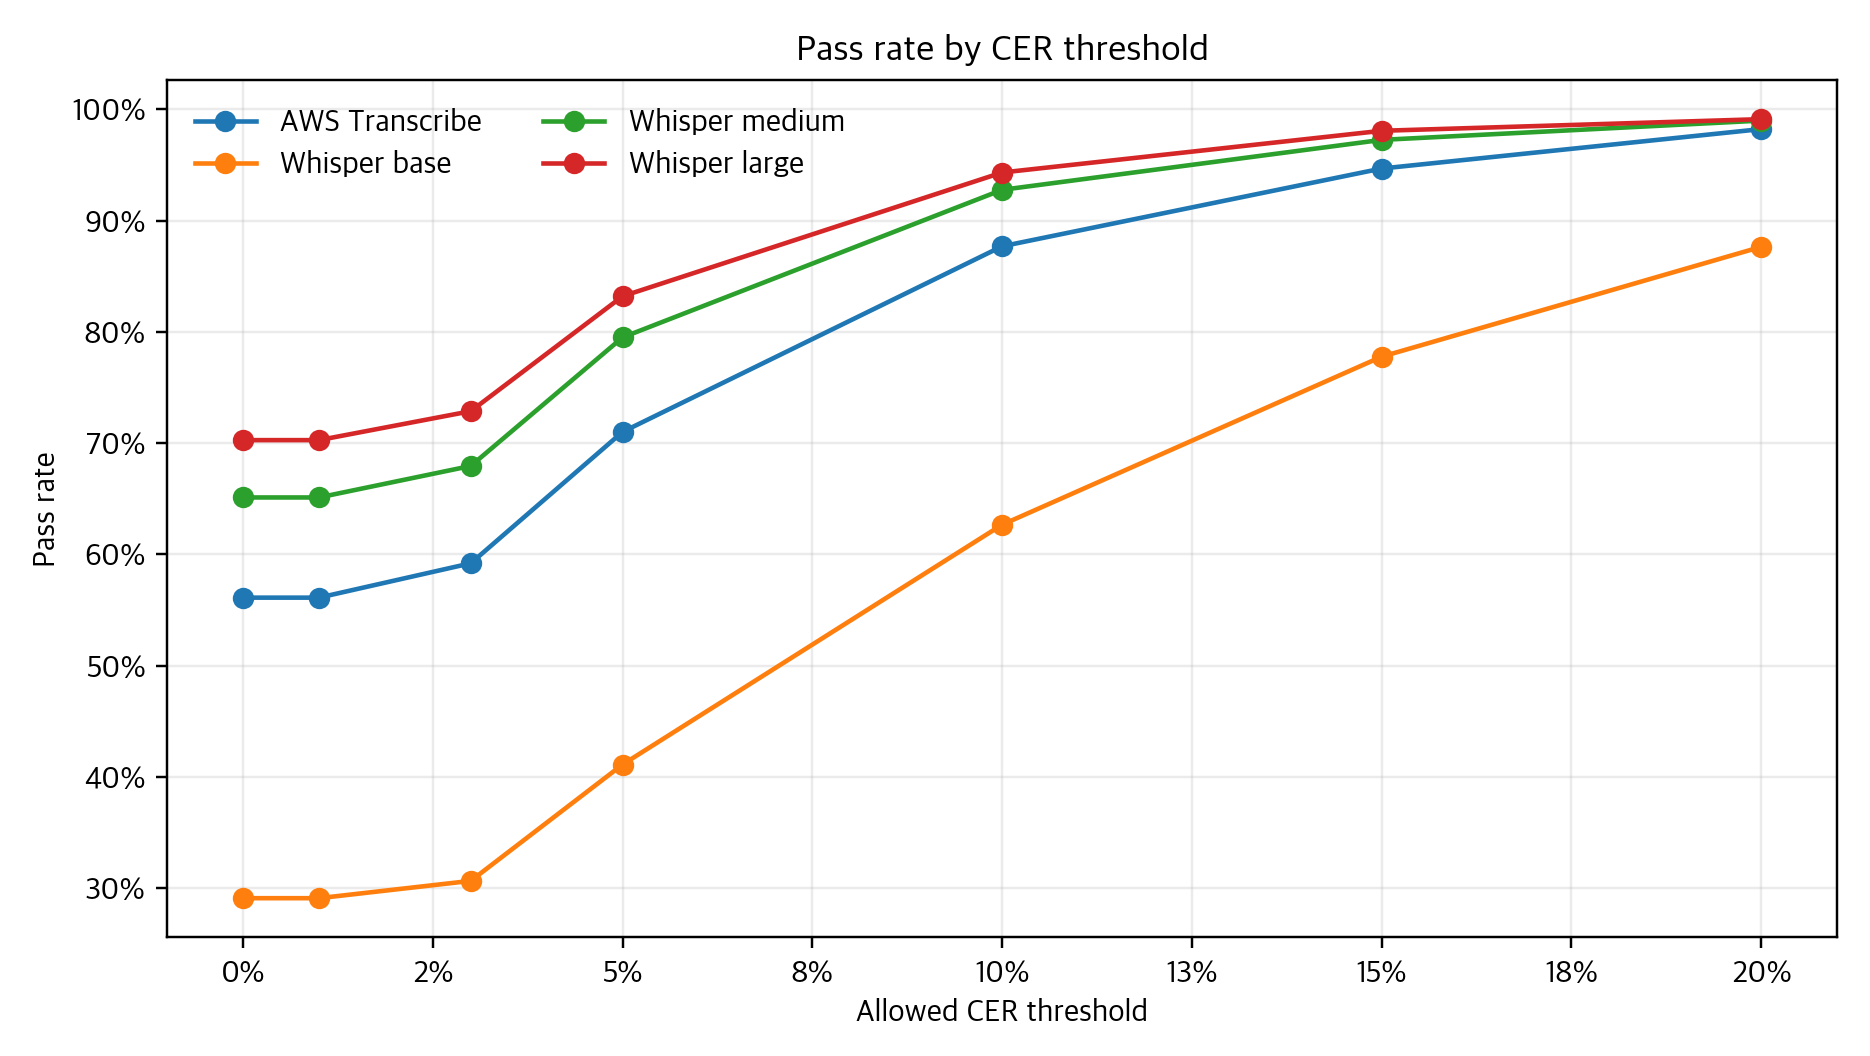
Action: average CER was not enough

I did not stop at mean CER. A mean gives the general direction, but a workflow cares about different questions: how many sentences can pass automatically, how many remain in a review queue, and where the tail risk lives. So I added perfect recognition rate, 5% pass rate, 10%+ tail risk, paired comparisons, disagreement examples, and call-center heatmaps.

The hardest part was not running one model. It was putting different providers' outputs on the same analytical surface. AWS, Azure, Clova, GCP, and Whisper outputs had different file shapes and transcript structures. In Korean, spacing, punctuation, and numeric notation can change CER materially. In the insurance persona, expressions like account numbers, amounts, and dates repeatedly showed the gap between meaning-level similarity and character-level scoring.

Conclusion: a benchmark is a measurement rule

On the single-speaker data, Whisper large and medium were strong, while AWS Transcribe was more stable than Whisper base. But that conclusion only applies to this repository's 2023 data, public products and models, and the CER policy used at the time. The more durable lesson is the method: ASR quality should be published with reference-text policy, thresholds, and tail risk, not only an average number.

Dataset

Two evaluation surfaces

The single-speaker dataset is the main benchmark for model-level distributions. The call-center dataset is a compact case analysis for number notation and financial-domain sensitivity.

Area Samples Compared systems Interpretation
Single speaker 3,922 utterances AWS Transcribe, Whisper base, Whisper medium, Whisper large CER distribution and threshold pass rates under one speaker and recording setup
Financial call center 3 scenarios x 2 reference bases AWS, Azure, Clova, GCP n=3 case analysis for numeric notation and domain sensitivity, not provider ranking
Single speaker

Look beyond the mean

Whisper large and medium were strong on the 3,922 utterances. For practical use, mean CER should be read together with perfect recognition, a 5% threshold, and the 10%+ tail.

Model Mean CER Median CER Perfect <=5% CER >10% CER
Whisper large 2.22% 0.00% 70.27% 83.20% 5.69%
Whisper medium 2.64% 0.00% 65.12% 79.50% 7.24%
AWS Transcribe 3.73% 0.00% 56.12% 71.01% 12.32%
Whisper base 9.35% 6.94% 29.12% 41.13% 37.33%
Single-speaker mean CER by model
Figure 1. Mean CER and 95% bootstrap confidence interval on the 3,922 single-speaker utterances. Source: result/*.csv.
Pass rate by CER threshold
Figure 2. Pass rate by CER threshold. Thresholds make the operational question more concrete than a mean alone.
Interactive

Model Performance Explorer

Move the threshold to see how pass/fail rates change. In call-center mode, switch the reference-text basis to see how numeric notation affects the scenario pass rate.

Dataset
Model / Provider
CER threshold
5%

Pass rate by model

CER <= 5% threshold

Pass Fail
Selected Whisper large
Mean CER 2.22%
Pass at threshold 83.20%
Tail / max risk 5.69% >10%
Settings

How to read the controls

The controls answer three questions: which dataset, which model or provider, and how much error is still acceptable for a pass. Lower CER means the transcript is closer to the reference text under this metric.

Dataset

Single speaker is the main 3,922-utterance benchmark for model comparison.

Call center is a small three-scenario financial dataset. It should be read as case analysis, not ranking.

Ground truth basis

Hangul uses a Korean-written reference, including numbers written as Korean words.

Numeric uses digit-style references. The same transcript can receive a different CER depending on notation.

For example, "십오억" and "15억" are close in meaning, but different at the character level.

Model / Provider

Choose the row to summarize. Single speaker mode shows models. Call center mode shows providers.

CER threshold

The maximum error rate counted as a pass. At 5%, only outputs with CER less than or equal to 5% pass.

Lower values are stricter. Higher values allow more transcripts to pass.

Pass / Fail

Pass is at or below the selected threshold. Fail is above it.

In call-center mode, the pass rate is the share of the three scenarios that pass.

Mean CER / Tail risk

Mean CER is the average error rate. Lower is closer to the reference under this dataset.

Tail risk shows how much large-error output remains even when the mean looks good.

Nlptutti CER

The original scripts called nlptutti.get_cer(reference, transcript) and stored the returned cer value.

The function counts S+D+I as errors and uses S+D+I+C as the denominator so insertion-heavy outputs do not dominate the scale.

This page summarizes the stored CER values. It does not recompute a new normalization policy for the blog.

Call center

Notation sensitivity, not ranking

The call-center data has only three scenarios. Read the means as compact summaries, then focus on how phone numbers, account numbers, amounts, and dates move when the reference changes between Hangul and numeric notation.

This auxiliary check came from a short 30-minute scenario recording with a few teammates. The chosen situations were PB bond ordering, startup-loan guidance, and an auto-insurance premium inquiry because they all stress numeric accuracy. In the meeting room, I used a personally purchased multi-pattern USB condenser microphone in bidirectional pickup mode to capture both sides of the one-to-one conversation as evenly as possible.

Call-center mean CER by provider
Figure 3. Provider mean CER over three financial call-center scenarios. This is an n=3 case summary.
Call-center CER heatmap by scenario
Figure 4. Scenario x provider CER heatmap. The PB bond-order scenario remained difficult across several providers.
Insurance persona AWS Azure Clova GCP
Hangul ground truth CER 11.99% 11.54% 30.80% 29.67%
Numeric ground truth CER 14.51% 8.79% 27.10% 28.58%

In the auto-insurance premium inquiry, changing the reference notation moved providers in different directions: Azure improved from 11.54% to 8.79%, while AWS moved from 11.99% to 14.51%. This is a reference-policy lesson, not a provider ranking.

Reproduce

Only real result files

The JSON and PNG assets on this page are generated from real repository files. No mock CSV is used for the blog.

uv run --python /usr/bin/python3 --with pandas --with numpy --with matplotlib python analysis/analyze_asr_benchmarks.py
  • Original measurement used nlptutti.get_cer(...) in measure_nlp_cer_job.py, oepnai_job.py, and measure_cs_job.py
  • The reanalysis uses stored cer values from existing result CSV files and does not create new CER values
  • Single-speaker CSV files are checked for matching file_name sets before paired comparison
  • Call-center row counts and scenario counts are checked before summarization
  • docs/assets/*.png and docs/data/asr-benchmark.json are regenerated from the analysis script
Single speaker measurement flow

The 3,922 recorded WAV files were sent to STT models or services. Each transcript was compared with the reference sentence using Nlptutti CER.

Results are stored in result/result_3922.csv and the Whisper-specific result/openai_whisper_*_result_3922.csv files.

Call center measurement flow

measure_cs_job.py reads Hangul and numeric references separately, then compares AWS/Azure/Clova/GCP transcripts against each basis.

That is why the same insurance transcript can have different CER values in cs_hangul_result.csv and cs_number_result.csv.

Test

How to test the page

The public page can be smoke-tested quickly, and the analysis outputs can be regenerated locally from the repository.

1. Open the public page

Open https://hyeonsangjeon.github.io/job-transcribe/en/.

The title, disclaimer, and three metric cards should be visible on first load.

2. Check Explorer defaults

The default state is Single speaker, CER threshold 5%, and Whisper large.

If Pass at threshold is 83.20% and Mean CER is 2.22%, the default data loaded correctly.

3. Switch to call center

Change Dataset to Call center. The default becomes Numeric ground truth, Azure, and a 10% threshold.

If Pass is 66.67%, Mean CER is 10.59%, and Tail / max risk is max 17.43%, the call-center data loaded correctly.

4. Regenerate locally

Run this command at the repository root.

uv run --python /usr/bin/python3 --with pandas --with numpy --with matplotlib python analysis/analyze_asr_benchmarks.py

If docs/assets/*.png and docs/data/asr-benchmark.json are regenerated, the analysis pipeline is working.

5. Serve locally

Start a static server.

python3 -m http.server 8765 --bind 127.0.0.1

Open http://127.0.0.1:8765/docs/en/ and confirm the same values appear.

6. Interpret carefully

This is a 2023 public-product and open-model experiment. It does not represent current vendor performance.

The call-center results have only three scenarios and should not be used as provider ranking.

Lessons learned

What stayed with me

The most durable part of this project was not the model-calling code. It was fixing the measurement rule so the experiment could be read again years later.

1. Mean CER is not enough for operational decisions. A mean shows the broad direction, but threshold pass rate and tail risk are closer to the decisions a product team makes.

2. Reference-text policy matters as much as model behavior. Korean spacing, punctuation, number notation, loanwords, and proper nouns can move CER materially. That is why the call-center cases are read as notation sensitivity, not provider ranking.

3. I built the metric tool because repeatability mattered. Nlptutti made it possible to measure 3,922 utterances and call-center transcripts through the same function. The S+D+I+C denominator kept insertion-heavy results comparable within a 0-1 normalized CER scale.

4. A small case analysis is not a leaderboard. The three call-center scenarios explain how numbers and domain terms can create errors. They do not generalize to current vendor performance.

5. A reproducible repository can bring an old experiment back to life. Because the recordings, result files, preprocessing CSVs, scripts, JSON, and PNG outputs were preserved, the three-month experiment could be revisited without inventing mock data.

Limits

Scope of interpretation

This page does not generalize model or vendor quality. It documents one 2023 experiment and the analysis assets that remained in the repository.

It does not represent current Microsoft/Azure, AWS, Clova, GCP, or OpenAI/Whisper performance.

It is not an official benchmark, internal performance dataset, or private vendor evaluation.

The 3,922 single-speaker utterances share one speaker and recording setup.

The call-center dataset is an n=3 case analysis and should not be used as provider ranking.

CER does not directly measure semantic preservation, speaker separation, timestamp quality, or punctuation quality.